Calculus: What is a function?
CCSS. Math. Content. 8.F.A.1: Define, evaluate, and compare functions.
Understand that a function is a rule that assigns to each input exactly one output. The graph of a function is the set of ordered pairs consisting of an input and the corresponding output.
Goal: My goal for the topic of functions is to have students understand inputs and outputs and use the vocabulary of domain and range. Specifically, I want this lesson to be more a student to student based discussion lesson. I'd like my students to observe and comment on the differences and similarities they see in the given diagrams. After their observations are made, the definition of a function will be given (if they are higher level thinkers, we can arrive at the definition together via the similarities observed) and students will then go back to identify which relations represent functions and also provide explanations.
The following two example problems make for great visual representations of inputs, outputs and whether these relations can be defined as functions. Given the definition of a function, an equation will be a function if, for any in the domain of the equation, the equation will yield exactly one value of when we evaluate the equation at a specific , students will use these problems/photos to determine if an equation is a function.
Problem # 1:
Before even providing the vocabulary associated with functions and its definition, students can identify the differences between options a and b in Problem # 1and also in Problem # 2, and the differences between the 4 inputs & outputs shown. Then, defining a function and what a function entails together as a class will follow. The solution will not be included until they identify the correct observations.
Problem # 1

For Problem # 1, Part a one domain value maps to two different range values, thus, the diagram doesn't represent a function. For Problem # 1, Part b each domain value maps to two range values and therefore the relation is not a function.
Problem # 2: Diagrams a-d (clockwise)
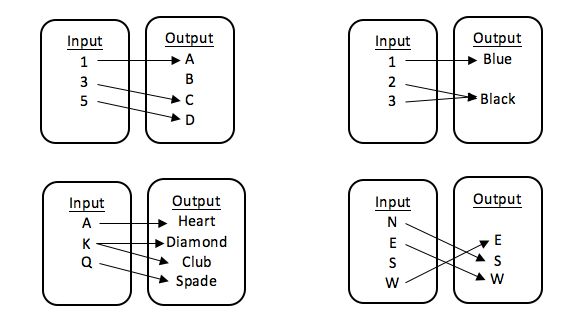
For Diagram A, for every unique input, there is one unique range value, thus, the diagram represents a general function. In Diagram B, input 2 and 3's domain values maps to only one range (making it a one-to-one) function. In Diagram C, every domain value maps to only one range value but input K maps to two range values (diamond and club) so the diagram represented is not a function. In Diagram D, every domain value maps to only one range value and every range value is the image of one domain value making this last map a function.
Additional Resources:
Math is Fun
http://www.montereyinstitute.org/courses/DevelopmentalMath/COURSE_TEXT2_RESOURCE/U17_L1_T1_text_final.html
https://www.khanacademy.org/math/algebra/x2f8bb11595b61c86:functions/x2f8bb11595b61c86:evaluating-functions/v/understanding-function-notation-example-1?modal=1
Reflection: These two examples/problems of my lesson help my students arrive at a definition of a function and the concept of domain and range through visual description. I think that these two examples show many options of how a function can be formed, in addition to how the domain can map to the range. Providing the visual representation along with a definition will allow for students use multiple learning styles to concretely understand what is a function. If student need additional resources, more visual examples and even Khan Academy's youtube video will provide a step by step alternative and will further extend the lesson when given an equation.
Understand that a function is a rule that assigns to each input exactly one output. The graph of a function is the set of ordered pairs consisting of an input and the corresponding output.
Goal: My goal for the topic of functions is to have students understand inputs and outputs and use the vocabulary of domain and range. Specifically, I want this lesson to be more a student to student based discussion lesson. I'd like my students to observe and comment on the differences and similarities they see in the given diagrams. After their observations are made, the definition of a function will be given (if they are higher level thinkers, we can arrive at the definition together via the similarities observed) and students will then go back to identify which relations represent functions and also provide explanations.
The following two example problems make for great visual representations of inputs, outputs and whether these relations can be defined as functions. Given the definition of a function, an equation will be a function if, for any in the domain of the equation, the equation will yield exactly one value of when we evaluate the equation at a specific , students will use these problems/photos to determine if an equation is a function.
Problem # 1:
Before even providing the vocabulary associated with functions and its definition, students can identify the differences between options a and b in Problem # 1and also in Problem # 2, and the differences between the 4 inputs & outputs shown. Then, defining a function and what a function entails together as a class will follow. The solution will not be included until they identify the correct observations.
Problem # 1
For Problem # 1, Part a one domain value maps to two different range values, thus, the diagram doesn't represent a function. For Problem # 1, Part b each domain value maps to two range values and therefore the relation is not a function.
Problem # 2: Diagrams a-d (clockwise)
For Diagram A, for every unique input, there is one unique range value, thus, the diagram represents a general function. In Diagram B, input 2 and 3's domain values maps to only one range (making it a one-to-one) function. In Diagram C, every domain value maps to only one range value but input K maps to two range values (diamond and club) so the diagram represented is not a function. In Diagram D, every domain value maps to only one range value and every range value is the image of one domain value making this last map a function.
Additional Resources:
Math is Fun
http://www.montereyinstitute.org/courses/DevelopmentalMath/COURSE_TEXT2_RESOURCE/U17_L1_T1_text_final.html
https://www.khanacademy.org/math/algebra/x2f8bb11595b61c86:functions/x2f8bb11595b61c86:evaluating-functions/v/understanding-function-notation-example-1?modal=1
Reflection: These two examples/problems of my lesson help my students arrive at a definition of a function and the concept of domain and range through visual description. I think that these two examples show many options of how a function can be formed, in addition to how the domain can map to the range. Providing the visual representation along with a definition will allow for students use multiple learning styles to concretely understand what is a function. If student need additional resources, more visual examples and even Khan Academy's youtube video will provide a step by step alternative and will further extend the lesson when given an equation.
Comments
Post a Comment